Thursday, December 28, 2017

Great Changes on the Lower Yellow River Channel since 2000 and Future Prospective

With the construction of large hydropower projects on the upper and middle reaches, the development of soil-water conservation and irrigation projects, the probability that a big flood event will occur and flood peak discharges have been greatly reduced. It is unnecessary to widen the lower-reach river to allow floodplain inundation for flood peaks reduction. In recent years, there is a major breakthrough in the understandings of the mechanism and capacity of the sediment transport in the narrow and deep channel of the Yellow River. Lower-reach channel has huge flood discharge and sediment transport capacity, which points out the future direction of harnessing the river. After the reconstruction of Sanmenxia Reservoir and the operational mode of “storing clear water and releasing muddy water” to reduce deposition, non-siltation has already been achieved for the channel upstream of Huayuankou. 


After the operation of Xiaolangdi Reservoir for 13 years, great changes have taken place in the lower-reach channel with maximum longitudinal water surface elevation reduction of 1.0-2.2 meters, and the bankfull discharge has been increased dramatically. But the wandering reaches are still wide, shallow, scatter and ill-conditioned, and they need to be regulated at both banks to form a stable, deep and narrow channel. Through multi-year sediment regulation of valley type of reservoirs like Xiaolangdi, the combinations of flow and sediment entering the lower-reach can be optimized, and the reservoir can be used for a long time. Sediment should be managed to be released when the discharge is greater than 3 000 m3/s, and it should be transported through the regulated new channel to the sea. By using this approach, the river bed will not be elevated by deposition, and the beneficial use of the reservoir will be significantly increased too.


Sunday, September 10, 2017

Hurricane IRMA Resulting Flood in Florida

After days of terrifying predictions, Irma arrived slammed into the Florida Keys on Sunday morning and the Florida mainland Sunday afternoon. It entered the state as a Category 4 hurricane and left as a still-powerful tropical storm. The related storm surge and inland flood so far is listed below:
  • Hurricane Irma made landfall at Cudjoe Key at 9.10am, Sept 3rd, with sustained winds of 130mph. Massive storm surges, estimated at 10ft or higher, inundated buildings, overwhelmed roads and cut off the Keys from mainland Florida.
  • Parts of downtown Miami flooded with rainwater and storm surges several feet deep, and tornadoes swept across swaths of south-eastern Florida. Winds toppled two construction cranes in downtown Miami, and all around south Florida brought down trees, live power lines, and street signs.
https://media.licdn.com/media-proxy/ext?w=800&h=800&f=n&hash=eaQxGSSBJNau6M7UpiXm7nsdAeQ%3D&ora=1%2CaFBCTXdkRmpGL2lvQUFBPQ%2CxAVta9Er0Vinkhwfjw8177yE41y87UNCVordEGXyD3u0qYrdfyTgK5HYeOf1uVtELnoclAIzePKgQDKzD5e8et--edpy2J_lIY27dA4BYBI3iSdF_NQ8
  • The storm then swept along the south-western coast line before making landfall again at Marco Island and Naples, at 3.35pm, as a category three storm, with sustained winds of 120mph, blinding walls of rain, and gusts as strong as 140mph. As it approached Naples, the storm’s winds temporarily drained Tampa Bay, raising fears that the weakened hurricane would still wallop cities with surges.
  • Hurricane Irma bared down on Fort Myers, north of Naples, within the hour as a category two storm, with sustained winds of 110mph. Storm surges have begun in and around Naples, with waters rising more than four feet in less than an hour and forecasts predicting as much as 10-15ft above ground level. From Naples earlier, went from negative surge to over 5 feet above ground level surge in 3 hours.
https://pbs.twimg.com/media/DJZ_ptEVwAUNsxB.jpg
  • Governor Rick Scott warned that south-west Florida could see storm surges of 10-15ft above ground – waves as tall as a one-story home, able to carry off people, cars, and mobile homes. Tampa should expect surges as large as five feet, and south-eastern Florida surges of three to six feet, high enough to float cars or envelop a person.
• The storm surge flooding would be the major concern for the coastal areas due to the strong wind. NOAA’s SLOSH model forecasts the inundation areas with maximum surge height from 10 to 15 feet for Tampa/Fort Myers.
• Rainfall occurring very quickly, at 2 to 4 inches per hour, will lead to flash flooding for urban areas.  Mountainous parts of the states will be especially vulnerable to flash flooding.
• Significant river flooding is likely over the next five days in the Florida peninsula and southeast Georgia, where average rainfall of 8 to 15 inches and isolated 20 inch amounts are expected. Based on 5 day rainfall forecast, there would be 10-15 inches of rainfall for the Central Florida, which might cause the riverine flood. FEMA has published the inland flood inundation areas based on this forecast.

Wednesday, August 30, 2017

Hurricane Harvey Induced Flood in Southeast Texas, USA


Hurricane Harvey is the first major hurricane to make landfall in the United States since Wilma in 2005, ending a record 12-year period with no storms making landfall as a major hurricane. Driven by relentless rains from Tropical Storm Harvey, the flood event becomes one of the worst disasters in modern U.S. history, which unfolded on Sunday, August 27 in the Houston area. Rainband after rainband swept north and translated slowly east through the metro area from Saturday into Sunday morning, dropping totals on the order of 20”-25” of rain. Freeways and streets throughout the Houston area were impassable on Sunday morning, and many hundreds of homes were flooded, with numerous reports of trapped residents. At least 6 deaths had been reported in the Houston area by end of Sunday. Throughout Texas, more than 300,000 people were left without electricity.
Rainfall Total and Record High Storm Surge by Sunday, August 27, 2017
As of 10 am CDT Sunday, the National Weather Service Storm Summary (updated every 6 hours) listed four locations near Houston that had received over 24 inches of rain since the storm began on Thursday. By far the two-day rainfall around Houston is now near or above 20 inches nearly everywhere, including a peak amount of 27.45 inches or 697 mm near Dayton. Another 6-15 inches is forecast on Sunday night, mostly to the north of the city.  Below is a map showing the spatial distribution of the rainfall map. In the Greater Houston/Southeast Texas region, an estimated 9 trillion gallons (3.4×10¹⁰ m3) of rain had fallen by the afternoon of August 27, more than any documented tropical system in U.S. history. The rainfall rate of 2.88 inches per hour was recorded at Buffalo Bayou, TX on Sunday as well.
https://pbs.twimg.com/media/DIRlNhgVwAAJF8N.jpg:large
At 1:24 pm CDT Sunday, the Manchester tide gauge, located on an estuary on the east side of Houston, recorded a remarkable storm surge that was nine feet and rising. This surge was likely 95% due to the huge amounts of freshwater river runoff trying to drain into Galveston Bay from August 26 morning’s torrential rains. This runoff was unable to drain because of strong onshore winds that were pushing a salt-water storm surge inland, opposing the freshwater runoff. The storm tide (combination of the surge plus the tide) was 8.66’ above the high tide mark (Mean Higher High Water, or MHHW) at Manchester at 1:24 pm CDT. This is a new record-high water level for the gauge, going back to when records began in 1998.
The rainfall totals over the past 72 hours are astounding. Harris County has recorded more than 32 inches of rainfall; Galveston County has registered just shy of three feet, at 34 inches. For Monday, Houston probably got a bit of a break from the heaviest downpours. The National Weather Service calls for “light to moderate rains across the area today and tonight” as Tropical Storm Harvey moves briefly offshore. Hopefully, this will allow some of the floodwaters to drain away in Houston, and if we’re really lucky there will be a break between the bands of additional rainfall that are currently projected to arrive on Tuesday and Wednesday in eastern Texas and southwestern Louisiana. According to NWS Houston, Monday's forecast rain from 7 AM to 7 PM is expected to be relatively lighter, up to 5" additional, isolated more.
Our top models have become a bit more consistent on Harvey’s short-term future. The storm’s center is now expected to move slightly offshore by Monday, still as a tropical storm, then return onshore by Wednesday on a northward track expected to be near or perhaps just west of Houston. The updated Harvey track map from NHC at 10am shows tropical storm force winds possible through Wednesday with still heavy flooding.

Based on NWS’s Weather Prediction Center’s 5-day river flooding forecast, a list of zip codes in TX that are currently impacted by flood induced by Harvey were created by JLT (orange area only). The region of impact is downloaded from NOAA WPC website, with event date from August 27 to Sept 1. The purpose of creating the list of impact zip code is to allow JLT Specialty to call their clients about these locations start from Monday morning. Below are the sample results for the impacted area in Houston, TX.
cid:image003.jpg@01D31FED.186A82A0
ESRI published the estimated Harvey flood footprints for the next 5 days (August 28 to Sept 1) for the State of TX. A screenshot can be found below for Houston. This is based on 2D flood simulation with forecasted rainfall on the digital terrain. Red color represents deeper water, while green color means shallow water. No depth information is given at this moment.

cid:image001.jpg@01D32037.9358D940

The rains in Cedar Bayou, near Mont Belvieu, Texas, reached 51.88 inches (132 centimeters) as of 3:40 p.m. CDT today. That's a record for both Texas and the continental United States, but it does not quite surpass the 52 inches (133 centimeters) from Tropical Cyclone Hiki in Kauai, Hawaii, in 1950 (before Hawaii became a state). The previous record was 48 inches set in 1978 in Medina, Texas, by Tropical Storm Amelia. A weather station southeast of Houston reported 49.32 inches of rain.
https://pbs.twimg.com/media/DIbRiLhV4AAMHLs.jpg
Rain totals for Tuesday afternoon and tonight showed that most of the area expecting less than an additional 6".
https://pbs.twimg.com/media/DIavPWNUMAAevBq.jpg

During noon time of Tuesday, FEMA published the Harvey flood depth grid for Harris County. This flood footprint was created based on a 5m DEM obtained via USGS (NextView data). The stream/river gages data were obtained from the National Weather Service (http://water.weather.gov/ahps/download.php).  Gage readings will be updated as streams to crest.  Gages that showed signs of malfunction or stopped reporting were not utilized.  Quality control is included at every step in the process, which include examining flood extents polygons and comparing to ground elevation data to identify anomalies that may suggest a source data problem (areas of more widespread flooding or areas where flooding seems unusually small). Delivered geo-databases include the following layers:
  • Depth grid
  • Approximate flood extents
  • Gage points used (includes stage readings, “gage 0” value, and calculated water surface elevation.
  • Areas of uncertainty

FEMA also performed flood damage assessment in the impacted area within TX. Below is the preliminary summary table showing the total number of structures and the affect level (depth of flood) for each county by Harvey in the state of TX. Of the note, this does not account for elevated structures and assumed that the parcel centroid is the building location. In addition, this does not account for wind damage, flooding from dam or levee breaks, flooding as a result of failure of irrigation ditches, use of spillways and weirs, small tributary flooding with minimal or no gage data, or stormwater backup. This data will be refined by FEMA using event imagery, when provided (yellow highlighted cells indicate damage assessment categories that need to be further reviewed due to discrepancies with the modeled output results).   
This map shows the FEMA created flood depth grid for Harris County, and the structure locations of flood damage assessment.
Based on FEMA created flood footprint for Harris County, JLT performed the analysis and identified Harvey impacted portfolio locations of UFG (221) and Church Insurance (2). According to FEMA’s preliminary Damage Assessment table (number of structures) in the previous page, since Harris County has the most flood loss, almost accounting for 70% of total loss, this analysis provides insights for our client for the majorities of their potential loss.

As for Harvey’s flood footprints, besides ESRI data and KatRisk predicted inland flooding areas, we also found Pacific Northwest National Laboratory also published daily forecast precipitation and forecasted flood footprint until August 29. The simulation used a 2-Day hindcast and a 5-Day forecast using the QPF data. Two simulation domains were utilized, one of which covers watershed within the heavier rain bands. A post-processing algorithm (CA) was used to refine the spatial resolution from the 2D hydrodynamic 120-meter simulations, with a focus on the Houston metropolitan area. The refinement is initialized from the coarse hydrodynamic simulation and uses hydrostatics to refine flood extents using 10-meter elevation data. The web link can be found at:

As tropical storm Harvey moves east, the weather forecast will improve for Houston for tomorrow. Harvey will spend much of Wednesday dropping rain on Louisiana before moving on to Arkansas, Tennessee and parts of Missouri, which could also see flooding.
More Rain Still to Come for Louisiana
Even more concerning is the prospect of additional extreme rains—one to two feet or more—before Harvey moves out of southeast Texas later this week. Points east from Houston into southern Louisiana will also be at an increasing risk of torrential rain and major flooding over the next several days. Harvey’s circulation is located in a near-ideal spot for funneling vast amounts of moisture from the Gulf of Mexico toward the upper Texas coast. Here, converging winds at low levels have been concentrating the moisture into north-south-oriented bands of intense thunderstorms with torrential rain. Since Harvey is barely moving, these bands are creeping only slowly eastward as individual cells race north along them—a “training” set-up that is common in major flood events.

Mesoscale models, our best guidance for short-term, small-scale behavior of thunderstorms, show little sign of relief for southeast Texas anytime soon. Convection-resolving mesoscale models, which have a tight enough resolution to depict individual thunderstorms, are an invaluable tool in situations like this. The mesoscale nested NAM model predicts that ~20” of additional rainfall is likely through Friday across the Houston metro area, with even larger totals at some points, as indicated by the figure below.

The threat of flash flooding is increasing across Southern Louisiana as soils saturate, while significant to catastrophic flash flooding continues across portions of Southeast TX, including the Houston metropolitan rea. The average rainfall within the Harris County Emergency Management Network has exceeded that of Tropical Storm Allison (2001) in almost half of the time (2-3 versus 5 days). Historic flooding is expected to continue in the Houston metropolitan area through the foreseeable future. Given that this event still has 2 to 4 more days to go, it appears likely that some location in Texas will break the all-time record for U.S. rainfall from a tropical cyclone or its remnants: 48.00” in 1979 from Amelia. Another record to watch:  the all-time 24-hour U.S. record rainfall of 42", set in Alvin, TX (just south of Houston) on July 25-26, 1979, in association with Tropical Depression Claudette.

As for the estimate of hurricane induced inland flood loss, Tropical Storm Allison caused $9 billion (in 2001 USD, equal to $12 billion USD as of 2017, of which $5 billion USD was insured) in damage and 41 deaths in June 2001. Given the fact that the rainfall intensity and its duration of another 2-4 days, with an estimated additional 5 to 10 trillion gallons (1.9×10¹⁰ to 3.8×10¹⁰ m3) of rain are expected before the storm dissipates, the flood loss caused by Harvey would be much worse than Tropical Storm Allison mentioned above.

Tuesday, June 20, 2017

Yellow River - Facts and Details (Part 3)

Places along the Yellow River

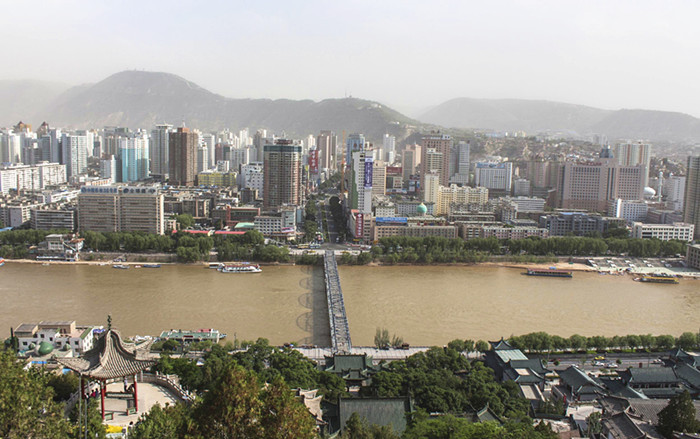
Lanzhou (9 hours by train or 2.5 hours by air from Beijing) is the largest city on the Yellow River and one of the most polluted cities in China if not the world (See Pollution). In the old days, it was regarded as one of the gateways to the Silk Road, the last major place to change to buy provisions before heading to Turkestan and Central Asia.
Today is an industrial city from petrochemical factories and brickyard kilns trapped inside a long, narrow Yellow River valley, flanked by mountains. The air pollution is so bad there has some discussion about blasting a hole in the mountains to allow the dirty air to escape.
Lanzhou is home to about 2 million people. It was described The New Yorker as “an assemblage pf rusting machinery, slag heaps, and landfills; of chimneys, brick kilns, and belching thick smoke; of concrete tenements whose broken windows are held together with cellophane and old newspapers."
Image result for Yellow River LanzhouTourist Office: Lanzhou Tourism Administration, 14-1 West Xijin Rd, 730050 Langzhou, Gansu, China, Map: Google Map. Lanzhou is accessible by air and bus and lies on the main east-west train line between Beijing and Urumqi, also the high-speed rail line.
Bingling (six hours from Lanzhou) means "thousand Buddha" in Chinese and "10,000 Buddhas” in Tibetan. Situated in Xiaoji Mountain, 20 miles southwest of Yongjing County, it is where people have been carving statues and niches into a two-kilometer stretch of steep cliffs above the surging Yellow river for more than 1000 years. There are 183 caves, 694 stone statues, 82 clay figures and 900 square meters of murals preserved here. The tallest statue is 80 feet high and the smallest is 20 centimeters. Two-thirds of the sculptures which are set up along four tiers were made over 1000 years ago. 
Yinchuan (10 hours by train or 3 hours by air from Beijing) is the most important city in Ningxia and was once the home of the mysterious Xia civilization. The main tourist sight is the Nanguan Mosque, built around 400 years ago and restored in 1981 after being damaged during the Cultural Revolution. To enter the mosque you go through a wonderful green tiled archway. The mosque itself is composed of two levels, topped by three slightly onion-shaped blue domes, the largest of which sits in the middle and is 70 feet high. The upper level contains a prayer hall with enough room for 1000 people. The bottom level houses bathing halls and residences for the imams.
Yinchuan lies on the Yellow River. The city has long depended on the river for water but these days its often little more than a narrow channel. On the northern side of Yinchuan is Haibao Pagoda, a strange, square-looking brick-and-stone structure that has 11 stories and reaches 160 feet into the air. If you feel adventurous there is a wooden ladder by which you can climb to the ninth floor. The ladder may or may not be open. Guesthouses can arrange camel rides through sand dunes and along the banks of the Yellow River.
Maps: Google MapGetting There: Yinchuan is accessible by air and bus and lies on the main east-west train line between Beijing and Urumqi. Travel China Guide (click transportation) Travel China Guide
Shapotou (160 kilometers from Yinchuan on the main east-west train line and the Yellow River) boasts a camel riding farm and offers dune sledding in the dunes of the Tengger Desert. Web Site: Lonely Planet Lonely Planet.

Dragon's Gate is the most spectacular of a series of gorges that squeeze the languid Yellow River into a raging torrent downriver from the Shaanxi Loess Plateau . Inside this 12-mile-long gorge, the Yellow River is compressed to a width, in some places, of only 50 feet by steep cliffs that rise up on both sides of the river.
Image result for Yellow River hu kou fall
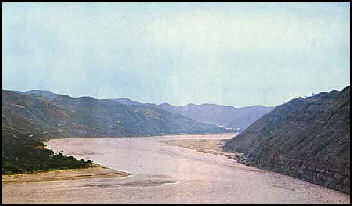
                                                               Yellow River at Hukou Falls in Shaanxi

Yan'an (230 kilometers north of Xian) is a shrine to Chinese Communism and place where many people still live in caves carved into the yellow cliffs. Located in the Shaanxi Loess Plateau , it was the termination point of the Long March. Mao, Zhou Enlai and others hid out in Yan'an from 1937 to 1947 and regrouped and eventually launched a major offensive from that transformed China into most populous communist nation in the world.
The revolutionary museum is one of the biggest tourist attractions in China, drawing more than four million visitors a year. Visitors can check out black and white photographs of the last stages of the Long March, buy Mao memorabilia and have their picture taken in front of the caves where the top Communist leaders stayed.
The post-Long-March compound at Yangjialing is near the mouth of a dry valley, just north of town. The four-cave complex where Mao lived and worked is tunneled into the side of a hillside. The canopy bed Mao is used us theatrically littered with cigarette butts, seemingly to illustrate the midnight oil spent developing strategies to fight the Japanese and the Nationalists. A photograph of the helmsman hangs over the desk where he used to work. Most of the visitors are uniformed soldiers and Communist Party members.
Yan’an now has a population of about 340,000 and has a booming economy thanks to the recent discovery of oil in the area.
Web Sites: Travel China Guide Travel China Guide Getting There: is accessible by air, bus and train from Xian. Travel China Guide (click transportation) Travel China Guide.
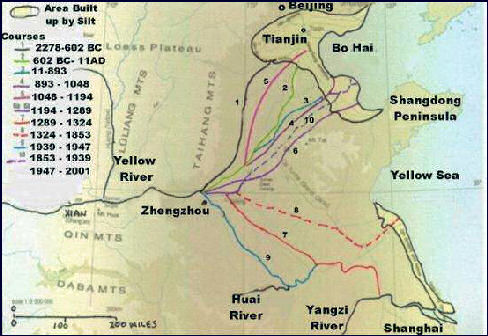
Mangshan Yellow River Tourist Center (32 kilometers northwest of Zhengzhou) is a 10-square-mile area known for four things: 1) a project that diverted the Yellow River to Zhengzhou; 2) the Yueshan Temple Scenic Spot, where Zijin Tower and Iron Chain Bridge are found; 3) Luotuo Bridge and the nearby Stele Forest of the Yellow River, with 570 stone pinnacles inscribed with calligraphy; and 4) the Hanba Erwangcheng Scenic spot, which contains two Shang-era archeological sites and a mountain with a wonderful view of the Yellow River.
Silk Road Trip . China .Zhongwei .Ancient sheepskin raft was used ... 
Yellow River Raft

Yellow River Boat Tours can be organized from Sanmenxia dam to Ruicheng. Along this 40-mile route you will see the Mausoleum for the Yellow Emperor, the Burial Ground for Carriages and Horses, the No. 1 dam on the Yellow River, the Pagoda of Baolun Temple, Shaanxian cave dwellings and hot springs. The water is calm around Sanmenxia but rough around Luoyang.
Longmen Caves (12 kilometers south of Luoyang) stretch for 1½ kilometers along a 100-foot-high cliffside on the west bank of Yellow River. Designated as a UNESCO World Heritage Site and considered one of the three great treasure houses of grotto art in China, the Buddhist caves features more than 2,345 caves and grotto niches, 43 pagodas, 3,600 tablets and 100,000 statues built over a 400 year period between A.D. 493 and 960.
The tallest is 50 feet tall and the smallest is only two centimeters. The best are comparable to the finest sculptures in the world. Others look like something a schoolchild could make.
Binyang Cave is the main cave in the group. Nearby is Thousand Buddha Cave. Fengxiansi Cave contains the largest group of images as well as some of the most expressive and expertly carved ones. Here, a 50-foot-tall Buddha stands alongside a Heavenly King crushing a demon and a 30-foot Lishi guardian with rippling muscles and fierce expressions---considered by some scholars to be finest sculptures in China. Many of the caves are filled with dripping water tainted by acid rain from produced by the nearby industrial city of Luoyang. UNESCO World Heritage Site Map: UNESCO Also try the UNESCO World Heritage Site Web site World Heritage Site

Tuesday, May 30, 2017

Yellow River - Facts and Details (Part 2)

Drying Up of Yellow River The Yellow River has dried up more than 30 times since 1972, when it ran dry for the first time in recorded history. It ran dry all but one year in the 1990s. In 1994, it ran dry for 122 days along a 180-mile section in Shandong, not far from where it empties into the Yellow Sea. In 1996 it ran dry 136 days. In 1997, for 226 days, denying water to 7.4 million acres of farmland and producing a dry riverbed that stretched more than 372 miles. The outflow o the river is just 10 percent of what t was in the 1940s. Timely releases of reservoir water kept it from drying up in the 2000s.
The Yellow River wasn't always like this. A resident of one town on the river told the Los Angeles Times, "Forty years ago, their was so much water that you could sit on the embankment, wait for fish to swim by, and go down ad catch them." Now he said, "There are no fish because there's not enough water for them to grow." In some places heavy equipment mines sand from the dry river bottom for construction work.
Water levels in 2008 were 60 percent of normal. In the early months of 2008, 600 million cubic meters of water was diverted to Beijing and Hebei and Shandong Provinces to help with a drought there an ensure there were adequate water supplies for the 2008 Olympics. More than 70 million cubic meters was diverted to the city of Qingdao, where the Olympics sailing events were held.
The Yellow River's problems begin at its source where droughts in the Tibetan plateau have reduced the amount of water flowing to the river. But the main reason the river runs dry is because between 80 to 90 percent of its water had been taken upstream for urban areas, industry and agriculture. Decline of water caused by global warming and the melting of Tibetan glaciers could make the situation worse.
Li Xiaoqiang of the Yellow River Conservancy Commission told AFP, “Everyone wants more water, the dams want water for electricity, the industries want water to increase production, the farmers want more water for irrigation and cities need water for daily living. We estimate that some provinces and regions will see rather large shortages during peak water use periods."
 A lot of water is wasted. Agriculture swallows up 65 percent of the Yellow River's water, with more than half lost to leaky pipes and ditches, with rest swallowed up by industry and cities. Twenty major dams punctuate the Yellow River and another 18 are scheduled to be built by 2030. Dams are particularly damaging on the Yellow River because they exacerbate silting and pollution. The reduced flow cause by dams causing silt to settle and prevents the flushing out if pollutants.
To keep the river flowing efforts are being made to distribute water more equitably and use it more efficiently. In August 2006, new laws were passed to better manage and reduce fights over the Yellow River. Beijing gave broad authority to the Water Resources Ministry to oversea management of the river in 11 provinces and municipalities and gave it a mandate to impose stiff fines and sanctions on officials that don't comply with the rules or take more than their share of water.
 Related image
Yellow River in Shandong
Yellow River Pollution: The Yellow River travels through major industrial areas, China's major coal producing region and huge population centers. By one count 4,000 of China's 20,000 petrochemical factories are on the Yellow River and a third of all fish species found in the Yellow River have become extinct because of dams, falling water levels, pollution, and overfishing.
More than 80 percent of the Hai-Huaih Yellow river basin is chronically polluted. Four billion tons of wastewater---10 percent of the river's volume---flows annually into the Yellow River. Canals that empty into it that were once filled with fish are now purple from the red wastewater from chemical plants. The water is too toxic to drink or use for irrigation and kills goats that drink from it.
In October 2006, a one-kilometre section of the Yellow River turned red in the city of Lanzhou in Gansu Province as result of a “red and smelly” discharge from a sewage pipe. In December 2005, six tons of diesel oil leaked into a tributary of the Yellow River from a pipe that cracked because of freezing conditions. It produced a 40-mile long slick. Sixty-three water pumps had to be shut down, including some in Jinan, the capital of Shandong Province.
 Every year the Yellow River absorbs 1 million tons of untreated waste from the city of Xian alone. A report issued in November 2008, declared that two-thirds of the Yellow River is heavily polluted by industrial waste and is unsafe to use. The Yellow River Conservancy Committee said that 33.8 percent of the samples taken from the river in various places registered worse than Level 5, meaning it was unfit for drinking, agriculture or industrial use. Only 16.1 percent of the samples reached Level 1 or 2---water considered safe for household use. The survey found that 73 percent of the pollutants came from industry, 23 percent came from households and 6.4 percent from “other sources." The report did not identify specific pollutants.
Around 50 percent of the river has been designated as biologically dead. In some areas along the river, there have dramatic increases in cancer, birth defects, and waterborne disease, Cancer rates in some places are so high they have been designated cancer villages. Among these is Xiaojidian, a village in Shandong on a tributary of the Yellow River. Water from tanneries, paper mills and factories is blamed from causing 70 people to die of the stomach or esophageal cancer in five years in a village with only 1,300 people. More than a thousand other in 16 neighboring villages have also died.

Yellow River Dams
The massive $4.17 billion Yellow River Dam built near Xiaolangdi in central China is the nation's second largest dam project after the Three Gorges Dam. The main purpose of the earthen dam is to halt the rising river by flushing out the silt. This will be accomplished with 16 reinforced tunnels that cut through an adjacent mountain which allows engineers to regulate the flow of water. During the wet season water can be stored in the reservoir to prevent flooding, and during the dry season, it can be released to flush out sediment as well as provide water for irrigation.
The reservoir behind the dam will be able to store water until the year 2020. At the time no more water can release to flush out the sediment down the river and the river and levees will once again start rising. "Our children and grandchildren will need to think of another solution to the silt problem," one engineer told Newsweek.
Work began on the Yellow River dam in 1994 with the building of huge roads for carrying out rocks and earth and the blasting of massive tunnels.

Image result for yellow river map

Yellow River map
The Yellow River dam will protect 120 million people from the river's notorious flooding; better allocate water so deprived farmlands get their share of irrigation water, and ensure the river doesn't dry up like it has in the past.
The dam will make 30 percent more water available for irrigation, which will reduce dependency on wells and groundwater, and produce 1,800 kilowatts of electricity (valued at $170 million a year). This is only a tenth of the power produced by much swifter moving Yangtze River at the Three Gorges Dam.
Unlike the Three Gorges project, the Yellow River dam has received a favorable reception from bankers and environmentalists. Its estimated cost is only a fourth of the Three Gorges Dam. The U.S Export-Import Bank and the World Bank have pledged over $1 billion in loans.
About 170,000 people who live in the Yellow River basin will have to be resettled to higher ground. Most of the resettled population have no objections about the move. Many are leaving mud-walled homes and small plots of land for modern homes with conveniences and large parcels of land.

Wednesday, April 19, 2017

GIS-Based Spatial Monte Carlo Analysis for Integrated Flood Management with Two Dimensional Flood Simulation

Spatial Monte Carlo Analysis (SMCA) is a newly developed Multi-Criteria Decision Making (MCDM) technique based on Spatial Compromise Programming (SCP) and Monte Carlo Simulation (MCS) technique. In contrast to other conventional MCDM techniques, SMCA has the ability to address the uneven spatial distribution of criteria values in the evaluation and ranking of alternatives under various uncertainties. Using this technique, a new flood management tool has been developed within the framework of widely used GIS software ArcGIS. This tool has a user-friendly interface which allows construction of user-defined criteria, running of SCP computations under uncertain impacting factors and visualization of results. This tool has also the ability to interact with and use of classified Remote Sensing (RS) image layers, and other GIS feature layers like census block boundaries for flood damage calculation and loss of life estimation. The 100-year flood management strategy for Oconee River near the City of Milledgeville, Georgia, USA is chosen as a case study to demonstrate the capabilities of the software. The test result indicates that this new SMCA tool provides a very versatile environment for spatial comparison of various flood mitigation alternatives by taking into account various uncertainties, which will greatly enhance the quality of the decision-making process. This tool can also be easily modified and implemented for solving a large variety of problems related to natural resources planning and management.


For full details of this paper, please find details below:

Wednesday, March 29, 2017

Yellow River - Facts and Details (Part 1)

The Yellow River is the second longest river in China and the cradle of Chinese civilization as the Nile is the cradle of Egyptian civilization. It originates in Tibet---like the Yangtze, China's largest river, and the Mekong River---and gets nearly 45 percent of its water from glaciers and vast underground springs of the Qinghai-Tibet plateau. From Tibet, it flows for 5,464 kilometers (about 3,400 miles) through Qinghai, Gansu, Ningxia, Inner Mongolia, the border of Shaanxi and Shanxi, Henan and Shandong before it empties into Bo Hai Gulf in the Yellow Sea.
nullThe Yellow River is known as the Huang in China. It is slow and sluggish along most of its course and some regard it as the world's muddiest major river, discharging three times the sediment of the Mississippi River. It gets its name and color from the yellow silt it picks up in the Shaanxi Loess Plateau. The Yellow River flows in braided streams, a network of smaller channels that weave in and out of each other. In each channel silt slowly builds the riverbed above the surrounding landscape and gives the river its devastating habit of breaking its banks and changing course,

nullThe Yellow River is vital to making northern China inhabitable. It supplies water to 155 million people, or 12 percent of the Chinese population, and irrigates 18 million acres---15 percent of China's farmland. More than 400 million people live in the Yellow River basin. Agricultural societies appeared on its banks more than 7,000 years ago. Web Sites: Wikipedia Wikipedia University of Massachusetts U Mass Yellow River Conservancy Commission Yellow River Conservancy Commission.

Yellow River Floods: Sometimes called the "River of Sorrow," the Yellow River is one of the world's most dangerous and destructive rivers. Since historians began keeping records in 602 B.C., the river has changed course 26 times and produced 1,500 floods that have killed millions of people. The root of these disasters is a large amount of silt generated by soil erosion.
From time to time the Yellow River overflows its banks and fills huge plains with large amounts of water. Floods sometimes occur when blocks of ice block the Yellow River. About once a century these floods reach catastrophic levels.
When the levees of the Yellow River break, which happens with some regularity, the countryside is devastated. When the river's dikes were breached in 132 B.C., floods occurred in 16 districts and a new channel was opened in the middle of the plain. Ten of millions of peasants were affected. The break remained for 23 years until Emperor Wu-ti visited the scene and supervised its repair.
In A.D. 11, the Yellow River breached its dikes near the same place, and the river changed course and forged a new path to the sea, a hundred miles away from its former mouth. Repair work took several decades.
In a tactic intended to halt the southward movement of Japanese soldiers from Manchuria before World War II, Chiang Kai-shek ordered his soldiers to breach the levees of the Yellow River and purposely divert its flow. At least 200,000, maybe millions, died, millions more were made homeless and the Japanese advanced anyway.
Sometimes when the Yellow River floods it becomes like a flowing mudslide. The river normally carries an enormous amount of silt and the amount increases when it floods. During a 1958 flood sediment levels were measured at 35 pounds per square foot, causing the river surface to become “wrinkled.
Rising Yellow River and Silt: Each year 1.5 billion tons of soil flows into the Yellow River. Sometimes there is so much sediment in the river it looks like chocolate milk. Three-fourths of this silt ends up in the Yellow Sea, with the remainder settling in the river beds, causing the level of the river to rise. Over the centuries the river has risen between 15 and 40 feet above the surrounding plains, in some cases with silt blocking off natural drainage channels and making areas more prone to flooding.
Technical problems posed by a large amount of silt and the rising water levels include: 1) the need to build higher and higher levees; 2) the need to continuously dredge large amounts of silt; 3) creating channels to release floods; and 4) building of dams to control floods. Dam building presents its own problems. The reservoir behind the Soviet-designed Yellow River dam built at Sanmenxia in 1960 silted up after only two years.
To hold the river back and prevent floods, the Chinese have built 800 kilometers of levees. Some of the levees are huge. Because water levels in the river rise every year, the levees also have to be raised. In many places, the river has sat above the surrounding landscape for some time. The journalist Edgar Snow wrote in 1961: "The riverbed [is] twenty to twenty-five feet above the surrounding countryside. I have watched junks sail overhead at that height."
Today, the Yellow River is above the landscape for much of its last 500 miles to the sea and the river continues to rise at an alarming rate of four inches a year. If a levee breaks, larger tracts of the countryside are vulnerable to flooding.

null

Monday, March 27, 2017

Oroville Dam Crisis: Potential Emergency Spillway Breach (February 2017) - Part II

Emergency spillway (also known as auxiliary spillway) length: ~1,700 ft.
Emergency spillway height (till rock rim): ~30 ft, which is mostly likely the breach height according to Mr. Mike Smith, a spokesman for the California Department of Forestry and Fire Protection, and confirmed with UC Berkley Civil Engineering Professor Dr.  Nicholas Sitar. The Oroville Dam itself is safe and will not fail during this event.
Surface area of this reservoir is: 15,805 acres
Volume of the Lake Oroville lost during this emergency spillway breach: 30 ft x 15,805 ac = 474,150 ac-ft
Dam breach peak discharge and duration is computed by Froehlich (2008) equation, developed by Dam Safety Division, Bureau of Reclamation, at Fort Collins, Colorado.
Average Breach Width: 803 ft
Breach Formation Time: 14.82 hours
Predicted Peak Discharge: 251,490 cubic feet per second (cfs), which is almost 20 times the maximum flood discharge through the hydro-electric generators outlet. This dam breach peak discharge is also twice of 100,000 cfs (2,800 m3/s), the peak rate which water flows over Niagara Falls, NY.