Friday, February 16, 2018

The Yellow River is becoming less silty, but ecologists disagree if this is a good thing (Global Times News)

○ Decades of efforts to harness the Yellow River have directly led to parts of the river becoming totally clear for the longest duration in history
○ Some experts warn that limiting the Yellow River's natural silt could upset the region's

ecological balance


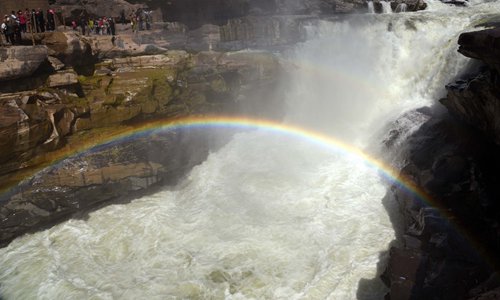
Tourists stand at Hukou Waterfall on the Yellow River to see the new, clean river with a rainbow. Photo: IC

The Yellow River, China's "mother river" known for thousands of years for its heavy concentrations of silt and sediment, is reported to have become permanently clear in some stretches. A rarity in history, the recent phenomenon has aroused fierce discussions and debates between environmentalists and ecologists. A recent report from Outlook Weekly magazine revealed that the Yellow River has become gradually clear, with dwindling sediment concentrations, starting in the year 2000. The river is now clean in the 1200-kilometer middle portion of the river, between Hohhot, Inner Mongolia Autonomous Region, and Taohuayu, Henan Province, which is the cut-off point between midstream and downstream.

It means that, together with the clear upstream, 80 percent stretches of the river are now totally clear in non-flood seasons. Throughout history, there have only been 43 reported instances of the Yellow River becoming clear. And yet, this clarity never lasted more than 20 days. The new phenomenon, which has lasted for years, is the longest duration in its history. This, of course, has excited experts, as it is considered the successful result of several generations worth of consistent efforts in "harnessing" the river, be it vegetation conservation or controlling silt and sediment, which can be traced back to 1946. But considering the environmental significance of the Yellow River, the difficulty in taming it and the potential dangers it still poses, there is no definitive consensus about whether this new clarity is a good or bad thing. Experts have reached a general consensus regarding the reasons for the new clarity, but they still hold different views as to how it will affect the environment in and around the river and other possible risks.


Reduced sediment

Compared with the 43 other times that the Yellow River has become clear, experts agree that those were probably accidental. Today's clarity is something altogether different and dramatic. But the Yellow River's new-found clarity is being attributed to China's ongoing efforts to conserve soil and water and the widespread use of reservoirs, experts have analyzed. For centuries if not millennia, the Yellow River carried 1.6 billion tons of sand on average every year. But between 2000 and 2015, the number suddenly dropped to 264 million. The upstream conservation of soil and water along the Loess Plateau played a significant role in this.

Sword of Damocles

There is also disagreement over how long the Yellow River will stay clear. Qi Pu, who used to be an engineer for the YRCC, believes it will become a trend for the Yellow River to become clear now that sand flow has been dwindling year on year.

For the full article, please visit Global Times: 

Wednesday, January 24, 2018

Mechanism of Efficient Sediment Transport by Hyperconcentrated Flow in the Lower Yellow River

The  Yellow  River, the second largest river in China, is well known as a  highly sediment-laden river. The average annual sediment inflow entering the Lower Yellow River (Figure 1) is 1.6 billion tons. Every year, there are around 400 million tons of sediment deposit on the lower reach of the Yellow River, which results in raising of river bed with  a speed of 10 cm per year. For decades, reduction of channel sedimentation has drawn the attention of hydraulic engineers and geomorphologists (Xu, 2003). In 1950, Soil-Water Conservation Project was initialized to control erosion in the Loess Plateau of the middle basin, which contributes 90% of the sediment loads. However, this project cannot completely solve the sediment problem, since there will be still 800 million tons of sediment yields annually after the project is finished (Qi and Li, 1996). As early as the 1960s, the hyper-concentrated flow occurring on the Loess  Plateau has been field investigated by hydraulic engineers.  The research on the hyper-concentrated flow of the Yellow River, which was originated by Dr. Ning Chien (Chien and Wan, 1999) in 1950’s, opens a new path by making full use of the channel for sediment transport. It has been evolved from pure theory into real engineering practices in recent years. 


In the first  International Workshop on Hyperconcentrated Flow held in Beijing in 1985, scientists from the United States reported on the sediment transportation by lahars and hyper-concentrated flows at Mount St. Helens, Washington (Scott and Dinehart, 1985, Janda and Meyer, 1985, Pierson and Scott, 1985). Brown (1988) advanced the understanding of sediment transport of bed material discharged in sand bed channels through the developed theoretical concepts related to the effects of high concentration of suspended sediment of the water-sediment mixture along with a  27-mile reach of the Cowlitz and Toutle Rivers in Washington. Julien and Lan (1991) used a physically based quadratic rheological model to test hyper-concentrated flows with experimental data. The model considers  (1) cohesion between particles;  (2) viscous friction between fluid and sediment particles; (3) impact of particles; and (4) turbulence. The resulting quadratic formulation of the shear stress was shown to be in excellent agreement with the experimental data sets. Rickenmann (1991) simulated fine-material slurry of a debris flow in a steep flume. The results showed that viscous effects became important below a limiting particle Reynolds number of about 10. Above this limiting value, density effects cause an increase in the bed-load transport rates as compared to similar conditions with clear water as transporting fluid. In the book authored by Wang and Wan  (1994), the rheological properties of hyperconcentrated flows were further revealed, as well as the mechanism of surface instability and drag reduction. Batalla et al.  (1999) analyzed the hyper-concentrated flow occurred after collapsing of a bridge in the Pyrenean Arás basin, Spain. The flood was characterized by transportation of large amounts of slope material, including debris flows.  Along the main tributary, an intensive hyperconcentrated flow was observed during the rising stage, whereas in the main valley smaller flows occurred after the failure of check dams. Lavigne and Suwa  (2004) carried out observation of debris flows, hyperconcentrated flows, and stream flows in the Curah Lengkong River on the southeast slope of Mount Semeru in East Java, Indonesia. This study provided quantitative data for these flows in motion, and it also compared the data for different types of flow that occur in the same river. The influence of rainfall on debris flows, hyperconcentrated flows,  and streamflow generation was also analyzed. A  detailed case  study  in  a  small  catchment  on  the  Loess  Plateau  conducted  by  Hessel  (2005) indicated  that  a  number  of  corrections  are  necessary  to  be  able  to  compare  field measurements  with  results  of  soil  erosion  models:  sediment  volume  should  be subtracted from runoff volume and a density correction is needed to use data from a pressure transducer.


Thursday, December 28, 2017

Great Changes on the Lower Yellow River Channel since 2000 and Future Prospective

With the construction of large hydropower projects on the upper and middle reaches, the development of soil-water conservation and irrigation projects, the probability that a big flood event will occur and flood peak discharges have been greatly reduced. It is unnecessary to widen the lower-reach river to allow floodplain inundation for flood peaks reduction. In recent years, there is a major breakthrough in the understandings of the mechanism and capacity of the sediment transport in the narrow and deep channel of the Yellow River. Lower-reach channel has huge flood discharge and sediment transport capacity, which points out the future direction of harnessing the river. After the reconstruction of Sanmenxia Reservoir and the operational mode of “storing clear water and releasing muddy water” to reduce deposition, non-siltation has already been achieved for the channel upstream of Huayuankou. 


After the operation of Xiaolangdi Reservoir for 13 years, great changes have taken place in the lower-reach channel with maximum longitudinal water surface elevation reduction of 1.0-2.2 meters, and the bankfull discharge has been increased dramatically. But the wandering reaches are still wide, shallow, scatter and ill-conditioned, and they need to be regulated at both banks to form a stable, deep and narrow channel. Through multi-year sediment regulation of valley type of reservoirs like Xiaolangdi, the combinations of flow and sediment entering the lower-reach can be optimized, and the reservoir can be used for a long time. Sediment should be managed to be released when the discharge is greater than 3 000 m3/s, and it should be transported through the regulated new channel to the sea. By using this approach, the river bed will not be elevated by deposition, and the beneficial use of the reservoir will be significantly increased too.


Sunday, September 10, 2017

Hurricane IRMA Resulting Flood in Florida

After days of terrifying predictions, Irma arrived slammed into the Florida Keys on Sunday morning and the Florida mainland Sunday afternoon. It entered the state as a Category 4 hurricane and left as a still-powerful tropical storm. The related storm surge and inland flood so far is listed below:
  • Hurricane Irma made landfall at Cudjoe Key at 9.10am, Sept 3rd, with sustained winds of 130mph. Massive storm surges, estimated at 10ft or higher, inundated buildings, overwhelmed roads and cut off the Keys from mainland Florida.
  • Parts of downtown Miami flooded with rainwater and storm surges several feet deep, and tornadoes swept across swaths of south-eastern Florida. Winds toppled two construction cranes in downtown Miami, and all around south Florida brought down trees, live power lines, and street signs.
https://media.licdn.com/media-proxy/ext?w=800&h=800&f=n&hash=eaQxGSSBJNau6M7UpiXm7nsdAeQ%3D&ora=1%2CaFBCTXdkRmpGL2lvQUFBPQ%2CxAVta9Er0Vinkhwfjw8177yE41y87UNCVordEGXyD3u0qYrdfyTgK5HYeOf1uVtELnoclAIzePKgQDKzD5e8et--edpy2J_lIY27dA4BYBI3iSdF_NQ8
  • The storm then swept along the south-western coast line before making landfall again at Marco Island and Naples, at 3.35pm, as a category three storm, with sustained winds of 120mph, blinding walls of rain, and gusts as strong as 140mph. As it approached Naples, the storm’s winds temporarily drained Tampa Bay, raising fears that the weakened hurricane would still wallop cities with surges.
  • Hurricane Irma bared down on Fort Myers, north of Naples, within the hour as a category two storm, with sustained winds of 110mph. Storm surges have begun in and around Naples, with waters rising more than four feet in less than an hour and forecasts predicting as much as 10-15ft above ground level. From Naples earlier, went from negative surge to over 5 feet above ground level surge in 3 hours.
https://pbs.twimg.com/media/DJZ_ptEVwAUNsxB.jpg
  • Governor Rick Scott warned that south-west Florida could see storm surges of 10-15ft above ground – waves as tall as a one-story home, able to carry off people, cars, and mobile homes. Tampa should expect surges as large as five feet, and south-eastern Florida surges of three to six feet, high enough to float cars or envelop a person.
• The storm surge flooding would be the major concern for the coastal areas due to the strong wind. NOAA’s SLOSH model forecasts the inundation areas with maximum surge height from 10 to 15 feet for Tampa/Fort Myers.
• Rainfall occurring very quickly, at 2 to 4 inches per hour, will lead to flash flooding for urban areas.  Mountainous parts of the states will be especially vulnerable to flash flooding.
• Significant river flooding is likely over the next five days in the Florida peninsula and southeast Georgia, where average rainfall of 8 to 15 inches and isolated 20 inch amounts are expected. Based on 5 day rainfall forecast, there would be 10-15 inches of rainfall for the Central Florida, which might cause the riverine flood. FEMA has published the inland flood inundation areas based on this forecast.

Wednesday, August 30, 2017

Hurricane Harvey Induced Flood in Southeast Texas, USA


Hurricane Harvey is the first major hurricane to make landfall in the United States since Wilma in 2005, ending a record 12-year period with no storms making landfall as a major hurricane. Driven by relentless rains from Tropical Storm Harvey, the flood event becomes one of the worst disasters in modern U.S. history, which unfolded on Sunday, August 27 in the Houston area. Rainband after rainband swept north and translated slowly east through the metro area from Saturday into Sunday morning, dropping totals on the order of 20”-25” of rain. Freeways and streets throughout the Houston area were impassable on Sunday morning, and many hundreds of homes were flooded, with numerous reports of trapped residents. At least 6 deaths had been reported in the Houston area by end of Sunday. Throughout Texas, more than 300,000 people were left without electricity.
Rainfall Total and Record High Storm Surge by Sunday, August 27, 2017
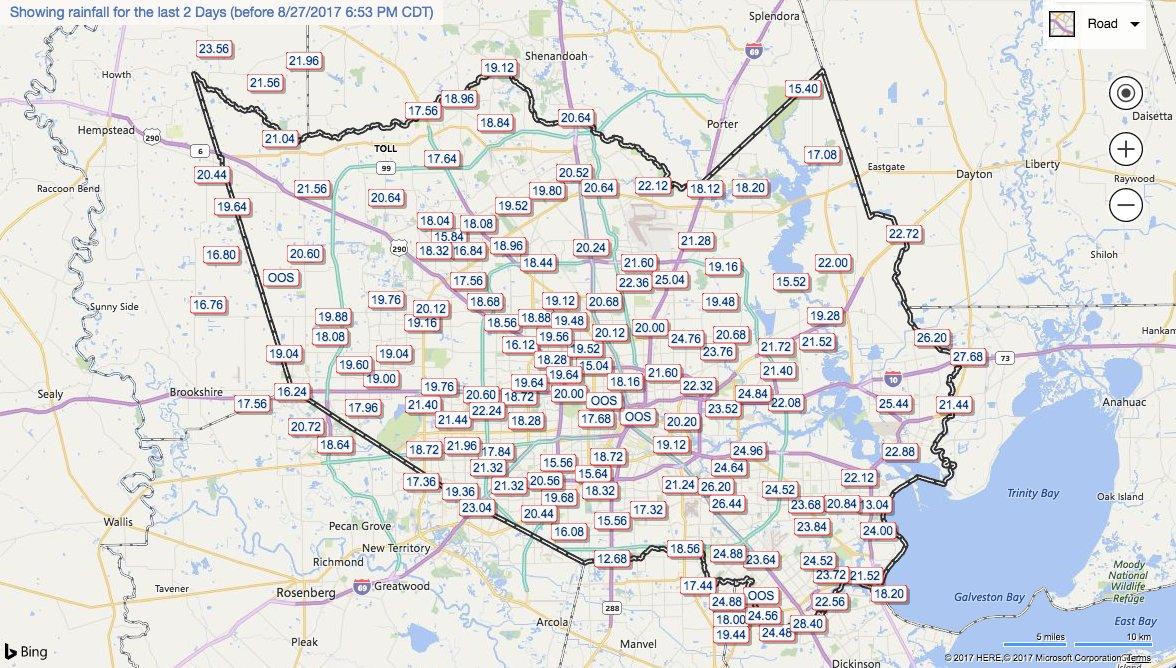
As of 10 am CDT Sunday, the National Weather Service Storm Summary (updated every 6 hours) listed four locations near Houston that had received over 24 inches of rain since the storm began on Thursday. By far the two-day rainfall around Houston is now near or above 20 inches nearly everywhere, including a peak amount of 27.45 inches or 697 mm near Dayton. Another 6-15 inches is forecast on Sunday night, mostly to the north of the city.  Below is a map showing the spatial distribution of the rainfall map. In the Greater Houston/Southeast Texas region, an estimated 9 trillion gallons (3.4×10¹⁰ m3) of rain had fallen by the afternoon of August 27, more than any documented tropical system in U.S. history. The rainfall rate of 2.88 inches per hour was recorded at Buffalo Bayou, TX on Sunday as well.
https://pbs.twimg.com/media/DIRlNhgVwAAJF8N.jpg:large
At 1:24 pm CDT Sunday, the Manchester tide gauge, located on an estuary on the east side of Houston, recorded a remarkable storm surge that was nine feet and rising. This surge was likely 95% due to the huge amounts of freshwater river runoff trying to drain into Galveston Bay from August 26 morning’s torrential rains. This runoff was unable to drain because of strong onshore winds that were pushing a salt-water storm surge inland, opposing the freshwater runoff. The storm tide (combination of the surge plus the tide) was 8.66’ above the high tide mark (Mean Higher High Water, or MHHW) at Manchester at 1:24 pm CDT. This is a new record-high water level for the gauge, going back to when records began in 1998.
The rainfall totals over the past 72 hours are astounding. Harris County has recorded more than 32 inches of rainfall; Galveston County has registered just shy of three feet, at 34 inches. For Monday, Houston probably got a bit of a break from the heaviest downpours. The National Weather Service calls for “light to moderate rains across the area today and tonight” as Tropical Storm Harvey moves briefly offshore. Hopefully, this will allow some of the floodwaters to drain away in Houston, and if we’re really lucky there will be a break between the bands of additional rainfall that are currently projected to arrive on Tuesday and Wednesday in eastern Texas and southwestern Louisiana. According to NWS Houston, Monday's forecast rain from 7 AM to 7 PM is expected to be relatively lighter, up to 5" additional, isolated more.
Our top models have become a bit more consistent on Harvey’s short-term future. The storm’s center is now expected to move slightly offshore by Monday, still as a tropical storm, then return onshore by Wednesday on a northward track expected to be near or perhaps just west of Houston. The updated Harvey track map from NHC at 10am shows tropical storm force winds possible through Wednesday with still heavy flooding.

Based on NWS’s Weather Prediction Center’s 5-day river flooding forecast, a list of zip codes in TX that are currently impacted by flood induced by Harvey were created by JLT (orange area only). The region of impact is downloaded from NOAA WPC website, with event date from August 27 to Sept 1. The purpose of creating the list of impact zip code is to allow JLT Specialty to call their clients about these locations start from Monday morning. Below are the sample results for the impacted area in Houston, TX.
cid:image003.jpg@01D31FED.186A82A0
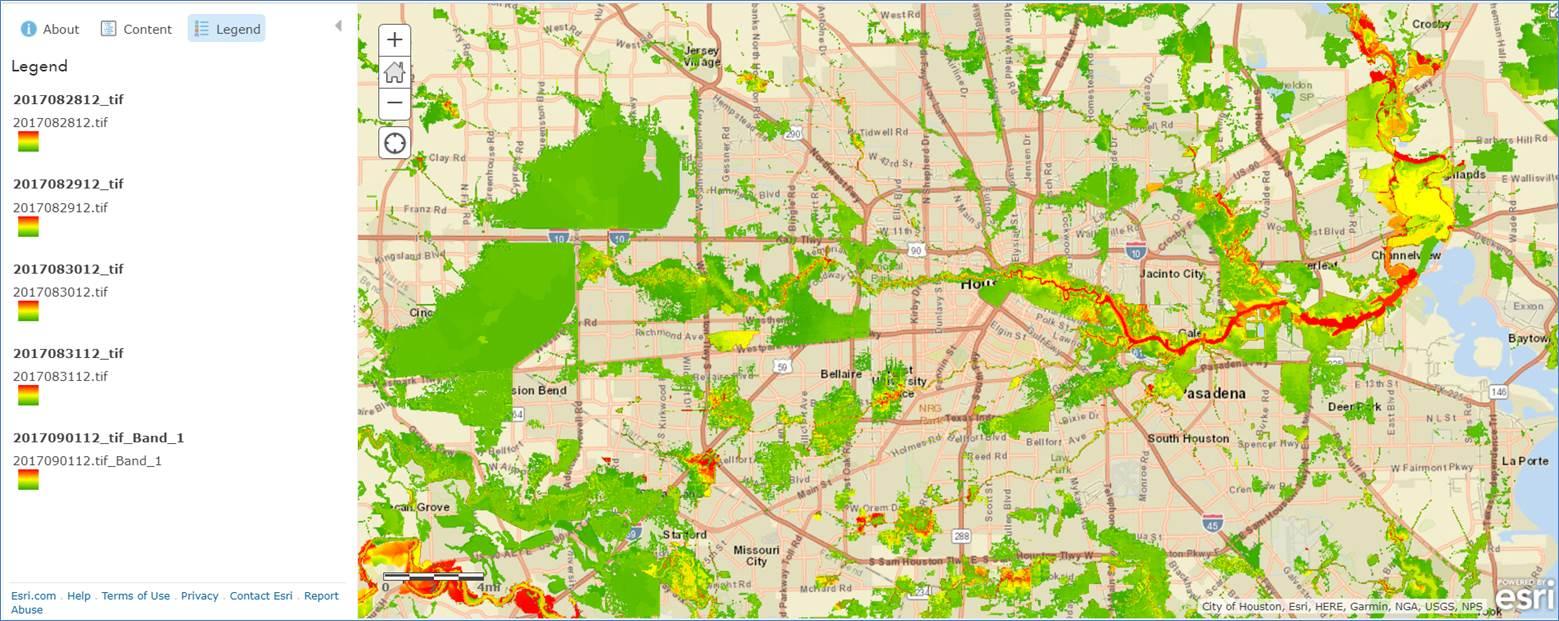
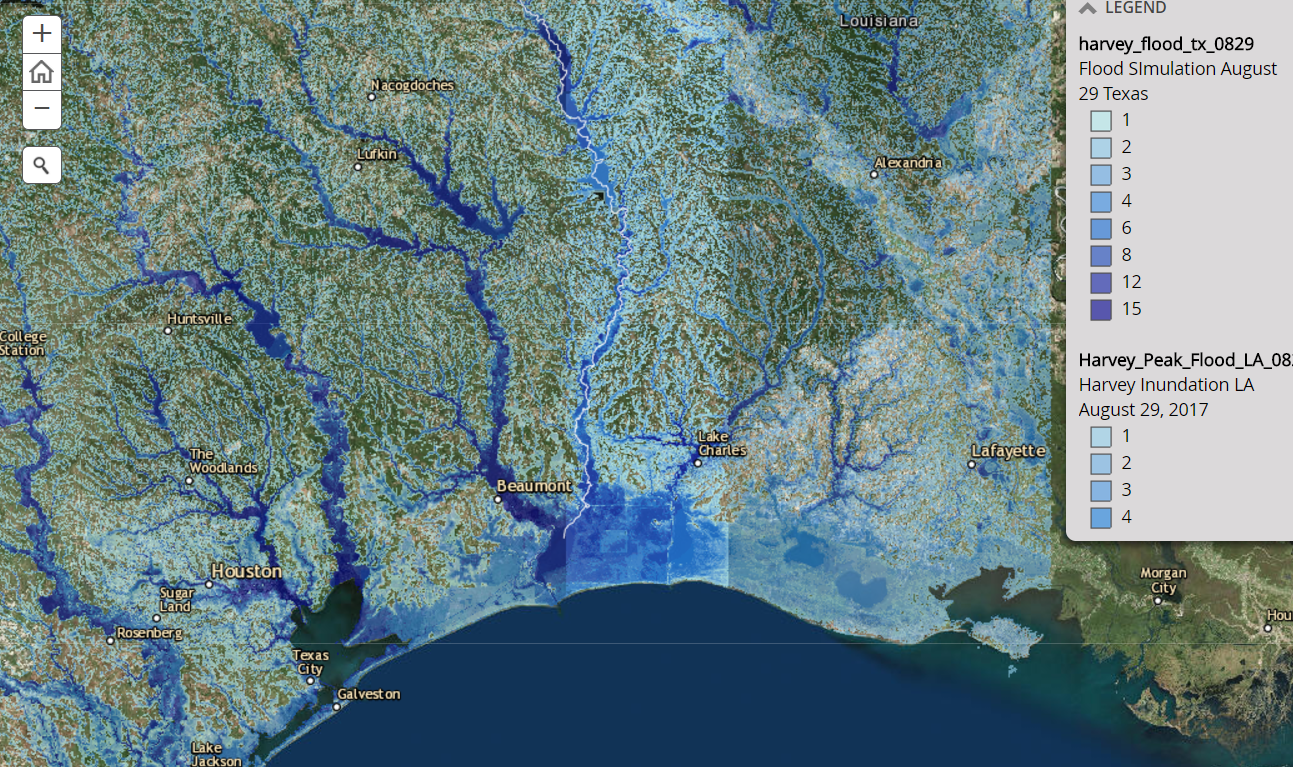
ESRI published the estimated Harvey flood footprints for the next 5 days (August 28 to Sept 1) for the State of TX. A screenshot can be found below for Houston. This is based on 2D flood simulation with forecasted rainfall on the digital terrain. Red color represents deeper water, while green color means shallow water. No depth information is given at this moment.

cid:image001.jpg@01D32037.9358D940

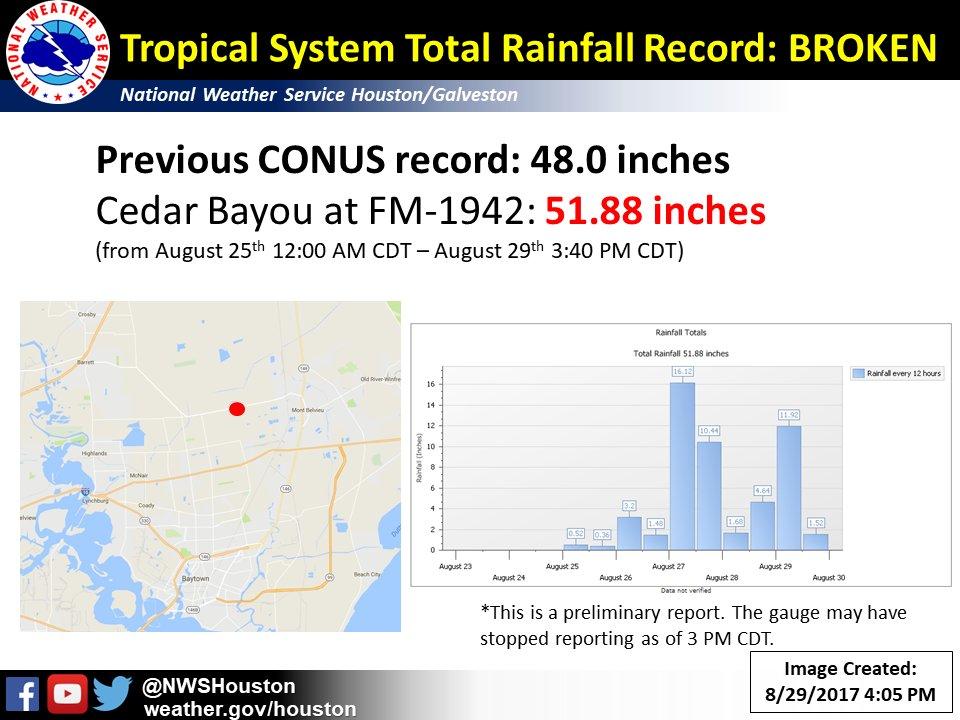
The rains in Cedar Bayou, near Mont Belvieu, Texas, reached 51.88 inches (132 centimeters) as of 3:40 p.m. CDT today. That's a record for both Texas and the continental United States, but it does not quite surpass the 52 inches (133 centimeters) from Tropical Cyclone Hiki in Kauai, Hawaii, in 1950 (before Hawaii became a state). The previous record was 48 inches set in 1978 in Medina, Texas, by Tropical Storm Amelia. A weather station southeast of Houston reported 49.32 inches of rain.
https://pbs.twimg.com/media/DIbRiLhV4AAMHLs.jpg
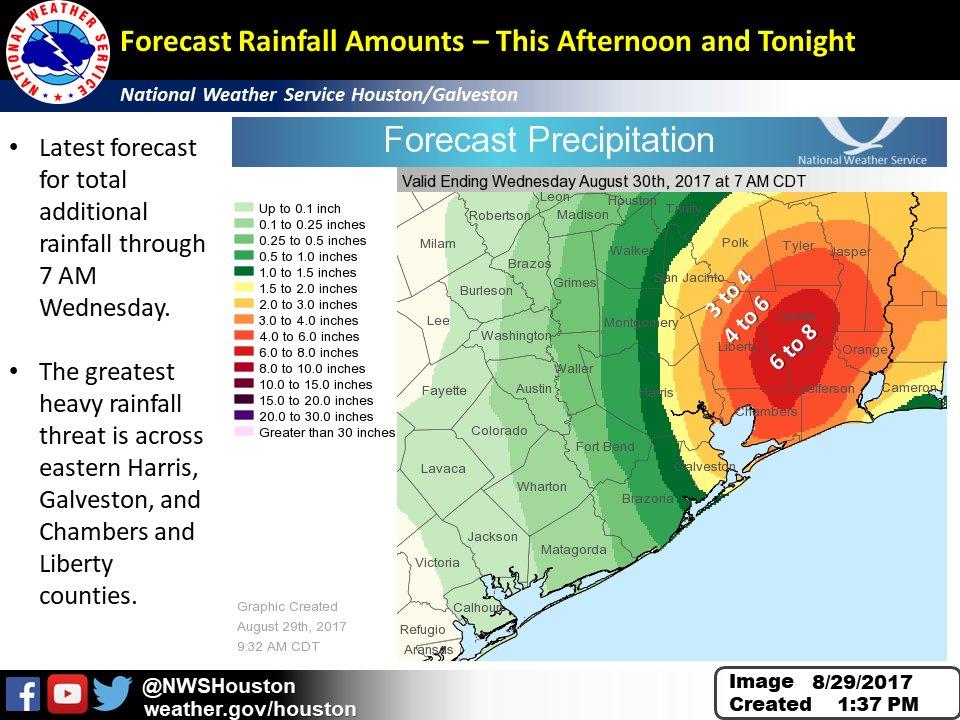
Rain totals for Tuesday afternoon and tonight showed that most of the area expecting less than an additional 6".
https://pbs.twimg.com/media/DIavPWNUMAAevBq.jpg

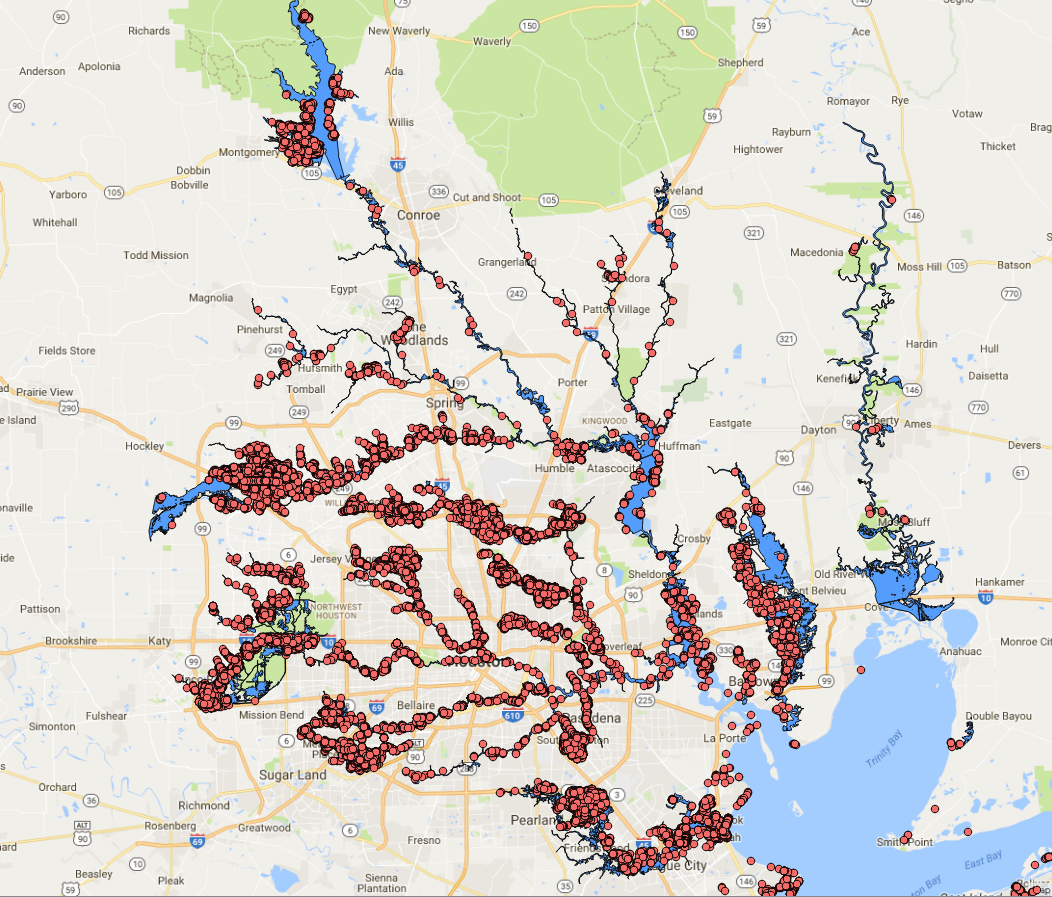
During noon time of Tuesday, FEMA published the Harvey flood depth grid for Harris County. This flood footprint was created based on a 5m DEM obtained via USGS (NextView data). The stream/river gages data were obtained from the National Weather Service (http://water.weather.gov/ahps/download.php).  Gage readings will be updated as streams to crest.  Gages that showed signs of malfunction or stopped reporting were not utilized.  Quality control is included at every step in the process, which include examining flood extents polygons and comparing to ground elevation data to identify anomalies that may suggest a source data problem (areas of more widespread flooding or areas where flooding seems unusually small). Delivered geo-databases include the following layers:
  • Depth grid
  • Approximate flood extents
  • Gage points used (includes stage readings, “gage 0” value, and calculated water surface elevation.
  • Areas of uncertainty

FEMA also performed flood damage assessment in the impacted area within TX. Below is the preliminary summary table showing the total number of structures and the affect level (depth of flood) for each county by Harvey in the state of TX. Of the note, this does not account for elevated structures and assumed that the parcel centroid is the building location. In addition, this does not account for wind damage, flooding from dam or levee breaks, flooding as a result of failure of irrigation ditches, use of spillways and weirs, small tributary flooding with minimal or no gage data, or stormwater backup. This data will be refined by FEMA using event imagery, when provided (yellow highlighted cells indicate damage assessment categories that need to be further reviewed due to discrepancies with the modeled output results).   
This map shows the FEMA created flood depth grid for Harris County, and the structure locations of flood damage assessment.
Based on FEMA created flood footprint for Harris County, JLT performed the analysis and identified Harvey impacted portfolio locations of UFG (221) and Church Insurance (2). According to FEMA’s preliminary Damage Assessment table (number of structures) in the previous page, since Harris County has the most flood loss, almost accounting for 70% of total loss, this analysis provides insights for our client for the majorities of their potential loss.

As for Harvey’s flood footprints, besides ESRI data and KatRisk predicted inland flooding areas, we also found Pacific Northwest National Laboratory also published daily forecast precipitation and forecasted flood footprint until August 29. The simulation used a 2-Day hindcast and a 5-Day forecast using the QPF data. Two simulation domains were utilized, one of which covers watershed within the heavier rain bands. A post-processing algorithm (CA) was used to refine the spatial resolution from the 2D hydrodynamic 120-meter simulations, with a focus on the Houston metropolitan area. The refinement is initialized from the coarse hydrodynamic simulation and uses hydrostatics to refine flood extents using 10-meter elevation data. The web link can be found at:

As tropical storm Harvey moves east, the weather forecast will improve for Houston for tomorrow. Harvey will spend much of Wednesday dropping rain on Louisiana before moving on to Arkansas, Tennessee and parts of Missouri, which could also see flooding.
More Rain Still to Come for Louisiana
Even more concerning is the prospect of additional extreme rains—one to two feet or more—before Harvey moves out of southeast Texas later this week. Points east from Houston into southern Louisiana will also be at an increasing risk of torrential rain and major flooding over the next several days. Harvey’s circulation is located in a near-ideal spot for funneling vast amounts of moisture from the Gulf of Mexico toward the upper Texas coast. Here, converging winds at low levels have been concentrating the moisture into north-south-oriented bands of intense thunderstorms with torrential rain. Since Harvey is barely moving, these bands are creeping only slowly eastward as individual cells race north along them—a “training” set-up that is common in major flood events.

Mesoscale models, our best guidance for short-term, small-scale behavior of thunderstorms, show little sign of relief for southeast Texas anytime soon. Convection-resolving mesoscale models, which have a tight enough resolution to depict individual thunderstorms, are an invaluable tool in situations like this. The mesoscale nested NAM model predicts that ~20” of additional rainfall is likely through Friday across the Houston metro area, with even larger totals at some points, as indicated by the figure below.

The threat of flash flooding is increasing across Southern Louisiana as soils saturate, while significant to catastrophic flash flooding continues across portions of Southeast TX, including the Houston metropolitan rea. The average rainfall within the Harris County Emergency Management Network has exceeded that of Tropical Storm Allison (2001) in almost half of the time (2-3 versus 5 days). Historic flooding is expected to continue in the Houston metropolitan area through the foreseeable future. Given that this event still has 2 to 4 more days to go, it appears likely that some location in Texas will break the all-time record for U.S. rainfall from a tropical cyclone or its remnants: 48.00” in 1979 from Amelia. Another record to watch:  the all-time 24-hour U.S. record rainfall of 42", set in Alvin, TX (just south of Houston) on July 25-26, 1979, in association with Tropical Depression Claudette.

As for the estimate of hurricane induced inland flood loss, Tropical Storm Allison caused $9 billion (in 2001 USD, equal to $12 billion USD as of 2017, of which $5 billion USD was insured) in damage and 41 deaths in June 2001. Given the fact that the rainfall intensity and its duration of another 2-4 days, with an estimated additional 5 to 10 trillion gallons (1.9×10¹⁰ to 3.8×10¹⁰ m3) of rain are expected before the storm dissipates, the flood loss caused by Harvey would be much worse than Tropical Storm Allison mentioned above.